Hinweis: Einige Seiten auf astro.uni-tuebingen.de können veraltet
sein und werden nicht mehr aktualisiert. Note: Some webpages at astro.uni-tuebingen.de may be outdated and
will no longer be updated.
If you click into the image the following information
is filled out at the right side of the image:
X and Y: the coordinates of the clicked position
Order: the Echelle order, which is identified for the
clicked position
Wavelength: the wavelength for this position, calculated from the
X-coordinate and the Echelle order.
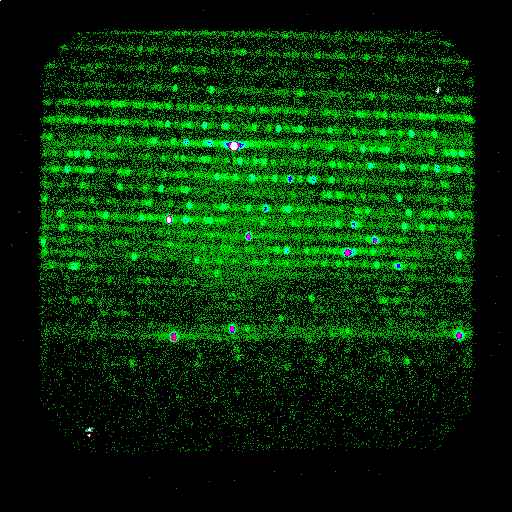
This spectrum was taken during FUV tests
at the IABG company in April 1996. For these FUV tests the upper
part of the telescope
together with the Echelle Spectrometer,
but without main mirror, was mounted in a large vacuum chamber.
The entrance diaphragm of the spectrometer was illuminated with
light from a gas discharge lamp. The lamp was operated with
a gas mix from Argon, Xenon and Krypton.
The intensity during these measurements was low, for this
image about 270 Photons per second were registered, the integration
time was 34 minutes. Gas discharge lamps produce light with
many emission lines, but there is practically no continuum. Further
below there is a table containing several
identified emission lines.
You will see that several lines, especially in the higher
orders, appear in two adjacent orders. This is due to the
fact, that the wavelength ranges of the individual orders
overlap for a certain range, which is the larger, the higher
the Echelle order is.
The entrance aperture of the spectrometer is a 20 arcsecond
diaphragm, i.e. during the astronomical observations this diaphragm shows
a circle of 20 arcseconds of the sky.
This is a relative large area as compared to the pointing accuracy
of the ASTRO-SPAS satellite. As the diaphragm is completely illuminated
during these laboratory measurements the emission lines apear
much more blurred than they were later during the astronomical
observations.
At the bottom left and the upper right corners there are bright
spots visible. These spots are produced by electronical test pulses,
which are recorded during all measurements. These test pulses will
allow to record changes of the electronics (e.g. caused by temperature
drifts), which could therefore be corrected later.
The wavelength calibration used for this page is based on a simple
linear calculation, its accuracy is about 0.2nm (depending on the accuracy
which can be achieved by placing the hand cursor of the browser).
The final wavelength calibration is much more detailed and thus
much more accurate.
The image shwon has a format of 512 x 512 pixels. During
the mission the images were recorded with 1024 pixels in horizontal
(main dispersion) direction.
This graphics shows the intensity of the 45th Echelle order.
Note that the wavelength scale runs in the reverse direction than the
pixel numbers, i.e. from right to left!
For extraction a stripe of 9 pixels was used, so that the complete
Echelle order was covered by this stripe. For each horizontal
pixel the intensity values (number of registered photons) of the
9 vertical pixels were added and the corresponding wavelength was calculated
for each horizontal pixel. The result is the picture shown above, which
shows the number of registered photons (counts) against the wavelength.
The wavelength unit is given in Angstrom: 10 Å = 1 nm.
This unit is no longer an official unit, but it is still preferred as
a unit for the wavelength of light.
In the final data reduction of the measured spectra the counted photons
are converted to the flux unit "photons/second/cm2". For this
conversion the effective area
of the instrument has to be considered together with the integration time.
Another common unit is "ergs/second/cm2", for which the
energy of a photon is converted to the energy unit erg.
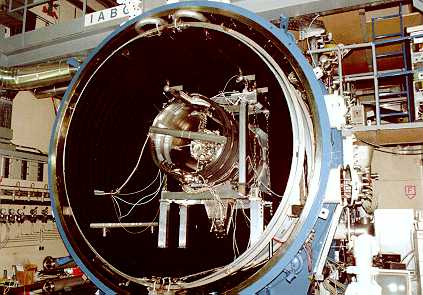
This image shows the upper part of the telescope with the echelle
spectrometer hanging downward in a vacuum chamber at the company IABG
in Ottobrunn. In the center of the telescope the spider pot is visible,
which will contain later the Berkeley spectrometer. The closed
telescope cover is located at the back side.
Main task of the FUV tests was the verification of the optical adjustment
and the focussing of the detector. As there is no active focussing of
the Echelle Spectrometer, the best focal position of the detector
had to be found by trial and error. The detector was then
mounted with the optimized focus position found during these tests.
The following table contains links to spectrum files used for the DARA school
project.. Each file contains the data for a single order of the total
spectrum of the FUV test.
![[AIT logo]](/aitlogo_x.gif)
![[Uni logo]](/unilogo_small.gif)